
Statistics on variables
Context
This feature allows to get statistics information's about data points values of a variable over a period of time using a threshold value as reference.
API management
The Insights api (https://api.opinum.com/swagger/ui/index#/Variables/Variable_GetStatistics) allows to query statistics on variable
Please refer to the online description provided by the API.
Period definition
You query statistics over a given period by giving a "from" and "to" date. These dates are considered local dates referring to the requested time zone. The request time zone is determined as follow:
| Request time zone | Condition |
|---|---|
| Time zone of the site | UseReportingTimezone is set to true |
| TimeZoneId | UseReportingTimezone is set to false and TimeZoneId is not empty |
| Time zone of the source | UseReportingTimezone is set to false and TimeZoneId is empty |
Note
TimeZoneId is a string that indicates a time zone either using Windows TimeZone (aka BCL) or IANA Zone ID (aka TZDB) name. By example, Windows TimeZone "Romance Standard Time" is equivalent to IANA Zone ID "Europe/Brussels"
Statistics results
Analog variable
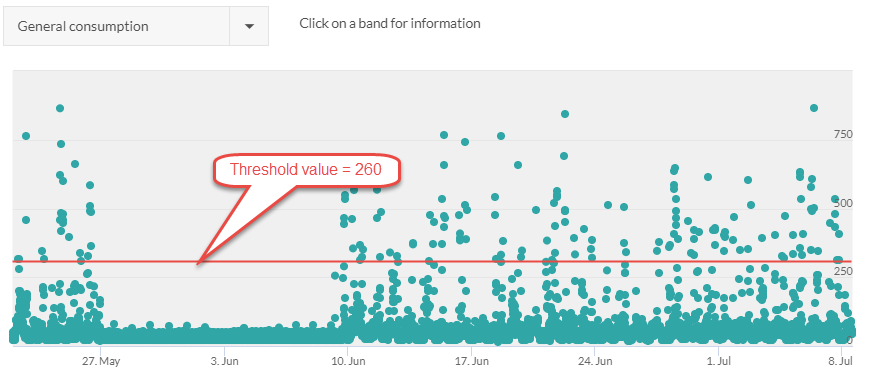
Invoking the statistics for this variable on a given period with a threshold value = 260 will give you the following results:
| Field | Description |
|---|---|
| SamplesCount | The number of data points found over the requested period |
| AboveThresholdSamplesCount | The number of data points over the requested period that were >= 260 |
| BelowThresholdSamplesCount | The number of data points over the requested period that were <> 260 |
| RisingEdgesCount | The number of transitions between values < 260 value >= 260 over the requested period |
| FallingEdgesCount | The number of transitions between values >= 260 value < 260 over the requested period |
| AboveThresholdTotalDuration | The accumulated duration of periods between rising and falling edges, i.e. the time during which the value of the variable was >= 260 over the requested period |
| BelowThresholdTotalDuration | The accumulated duration of periods between falling and rising edges, i.e. the time during which the value of the variable was < 260 over the requested period |
| AboveThresholdMinDuration | The shortest duration between a rising and a falling edge, i.e. the minimum time during which the value of the variable was >= 260 over the requested period |
| BelowThresholdMinDuration | The shortest duration between a falling and a rising edge, i.e. the minimum time during which the value of the variable was < 260 over the requested period |
| AboveThresholdMaxDuration | The longest duration between a rising and a falling edge, i.e. the minimum time during which the value of the variable was >= 260 over the requested period |
| BelowThresholdMaxDuration | The longest duration between a falling and a rising edge, i.e. the minimum time during which the value of the variable was < 260 over the requested period |
| AboveThresholdDurationRatio | The ratio between AboveThresholdTotalDuration and the duration of the requested period, i.e. the fraction of time in the requested period during which the value of the variable was >= 260 |
| BelowThresholdDurationRatio | The ratio between BelowThresholdTotalDuration and the duration of the requested period, i.e. the fraction of time in the requested period during which the value of the variable was < 260 |
| MaxValue | The maximum value among all data points values over the requested period |
| MinValue | The minimum value among all data points values over the requested period |
| AverageValue | The average value of all data points values over the requested period |
| AverageAboveValue | The average value of all data points values >= 260 over the requested period |
| AverageBelowValue | The average value of all data points values < 260 over the requested period |
Binary variable
A binary variable only contains values 0 or 1.
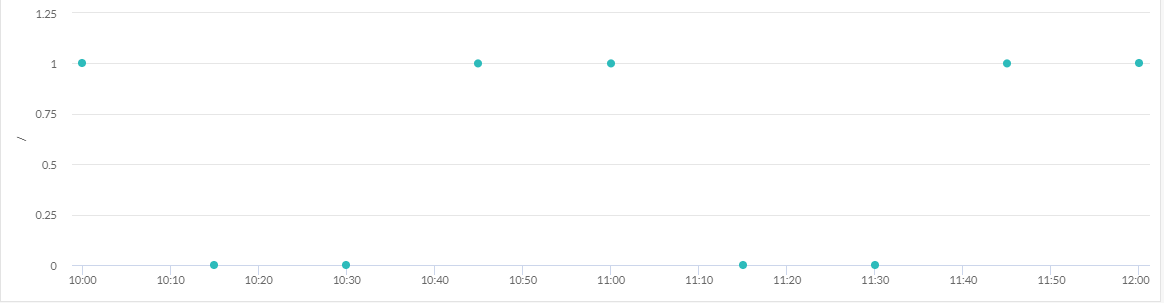
Let's say that data points = 0 are called FALSE and data points = 1 are called TRUE. You may get statistics on such variables by setting the threshold value to 1. Doing that, although all statistics fields will be filled, only a part of them contain meaningful information's:
| Field | Description |
|---|---|
| SamplesCount | The number of data point found over the requested period |
| AboveThresholdSamplesCount | The number of TRUE data points over the requested period |
| BelowThresholdSamplesCount | The number of FALSE data points over the requested period |
| RisingEdgesCount | The number of transitions between FALSE and TRUE over the requested period |
| FallingEdgesCount | The number of transitions between TRUE and FALSE over the requested period |
| AboveThresholdTotalDuration | The accumulated duration of periods between rising and falling edges, i.e. the time during which the value of the variable was TRUE over the requested period |
| BelowThresholdTotalDuration | The accumulated duration of periods between falling and rising edges, i.e. the time during which the value of the variable was FALSE over the requested period |
| AboveThresholdMinDuration | The shortest duration between a rising and a falling edge, i.e. the minimum time during which the value of the variable was TRUE over the requested period |
| BelowThresholdMinDuration | The shortest duration between a falling and a rising edge, i.e. the minimum time during which the value of the variable was FALSE over the requested period |
| AboveThresholdMaxDuration | The longest duration between a rising and a falling edge, i.e. the minimum time during which the value of the variable was TRUE over the requested period |
| BelowThresholdMaxDuration | The longest duration between a falling and a rising edge, i.e. the minimum time during which the value of the variable was FALSE over the requested period |
| AboveThresholdDurationRatio | The ratio between AboveThresholdTotalDuration and the duration of the requested period, i.e. the fraction of time in the requested period during which the value of the variable was TRUE |
| BelowThresholdDurationRatio | The ratio between BelowThresholdTotalDuration and the duration of the requested period, i.e. the fraction of time in the requested period during which the value of the variable was FALSE |
MaxValue, MinValue, AverageValue, AverageAboveValue and AverageBelowValue are not meaningful in the case of binary variables.
Initial value
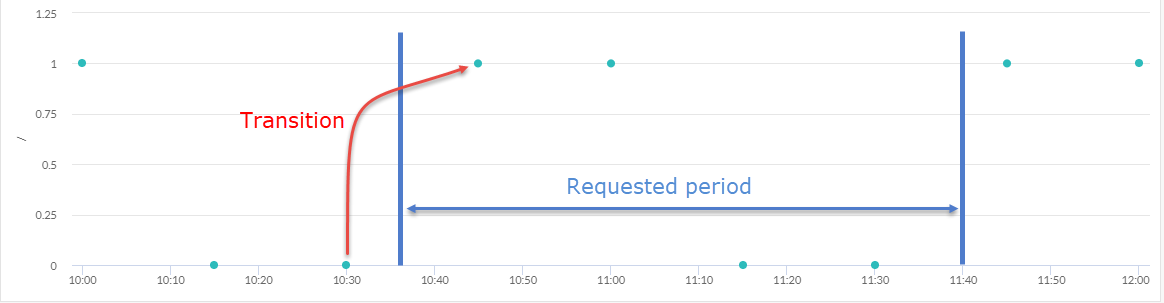
The initial value is the value (not contained in the requested period) that will be used as reference to compare the value of the first data point in the requested period. This is important to know if the first data point is a transition (from value below/above threshold to value above/below threshold) or not.
In the following example, the first TRUE datapoint is a transition because the previous data point was FALSE
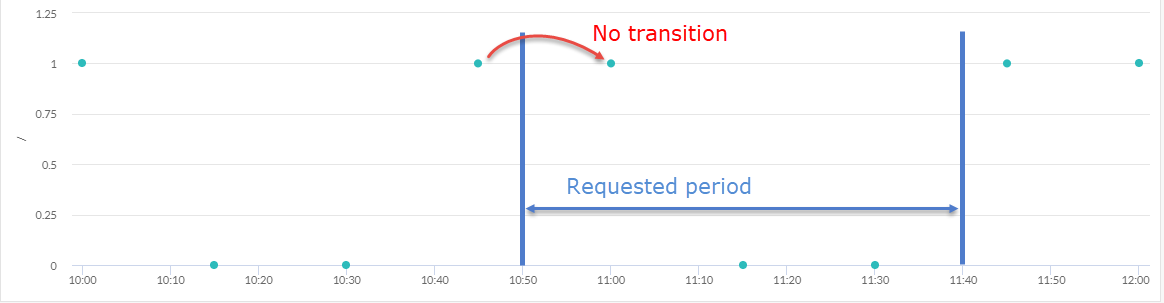
In the next example, the first TRUE datapoint is not a transition because the previous data point was already a TRUE one.
The initial value is determined by the value of the last (youngest) data point over a period of time (called initial period) equal to 10 times the average period of the samples in the requested period, ending (not inclusive) at the the start of the requested period.
Note
If no data point exist in the initial period, the value of the first (oldest) data point in the requested period will be used as the reference value.
Aggregation
Instead of getting one statistics field set for the whole requested period, you can get aggregated statistics per day, month or year. In this case, data points belonging to the requested period are grouped by aggregation period, the initial value of each period (except the first one) being the value of last data point in the previous period.
Empty aggregated periods will be produced for all periods having no data point: if there are data points for month 1 and 3 (no data point for month 2) and you ask for a month aggregation over period (month1..month3), you'll get 3 statistics result sets, the one corresponding to month2 being "empty" (SampleCount = 0).
Limitations
In order to protect the Insights backend against heavy load, the requested period may not exceed 366 days. Should you need longer period, you must divide it into periods <= 366 days.
Count data points
Although you can get the number of data points of a variable over the requested period through the statistics, this if far from being efficient because te statistics engine fetches the RAW data points to compute the statistics.
Important
If your sole purpose is to count the number of data points of a variable, please use https://api.opinum.com/swagger/ui/index#/Variables/Variable_CountDataPoints instead. This endpoints uses pre-aggregated data points which is much more efficient.